
In the most recent issue of the American Historical Association’s Perspectives on History, Julia Brookins described some disturbing findings on the latest trends in the number of history degrees in higher education.
|
|
“The number of history BAs and BSs completed in the United States fell for the third time in four years, this time by 9.1 percent from the previous year, from 34,360 to 31,233. This is the largest year-to-year change for undergraduate history degrees since a 9.8 percent increase in 1992.” |
Using data from the National Center for Education Statistics, Brookins asserts that the large drop in history baccalaureate degrees earned last academic year is part of a downward trend that will continue through the decade.
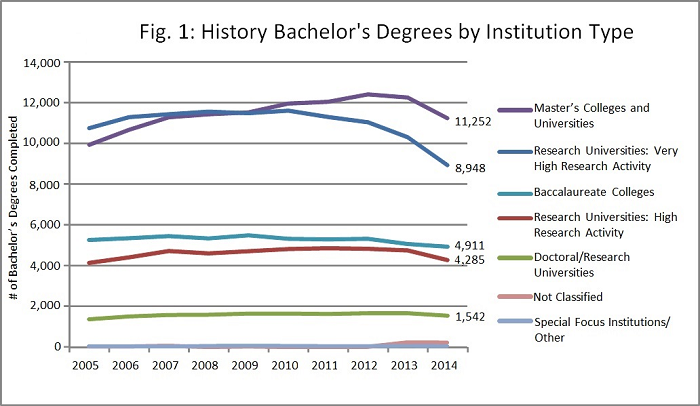
from Brookins, “New Data Show Large Drop in History Bachelor’s Degrees,” AHA Perspectives on History (March 2016)
The institution types listed above are based on the Carnegie classification system – for example, the University of Kentucky and the University of Louisville are classified as “Research Universities: Very High Research Activity.” This is the group of universities, nationally, that saw the deepest drop in history bachelor’s degrees.
In Kentucky, according to the Kentucky Council on Postsecondary Education’s data profiles (baccalaureate degrees by institution and major start on page 91), the drop over time has been happening since 2008 for our research institutions, while the public comprehensive institutions are generally doing well, with Northern Kentucky University offering a huge increase in history degree production. Overall, the public comprehensive institutions have kept our history bachelor’s degree production on the increase in Kentucky.
| KY Public Postsec Institution | ’08-09 | ’09-10 | ’10-11 | ’11-12 | ’12-13 | Total in 5 yrs |
| Morehead State University | 7 | 11 | 15 | 15 | 17 | 65 |
| Murray State University | 31 | 26 | 24 | 22 | 13 | 116 |
| Eastern Kentucky University | 25 | 27 | 42 | 33 | 47 | 174 |
| Western Kentucky University | 18 | 39 | 30 | 43 | 49 | 179 |
| Northern Kentucky University | 49 | 60 | 34 | 43 | 73 | 259 |
| University of Louisville | 57 | 54 | 53 | 63 | 47 | 274 |
| University of Kentucky | 83 | 75 | 73 | 67 | 70 | 368 |
| Totals by Academic Year | 270 | 292 | 271 | 286 | 316 |
(Note: Kentucky State University does not offer a degree in history.)

